SMS marketing metrics analyzing essential knowledge and tips
eCommerce
Analytic is an important stage of any marketing campaign. SMS marketing campaigns are not the exception. If you want to do better marketing and improve sales performance, you have to know how to analyze your marketing data and evaluate it.

In this part, we will show you some basic SMS marketing metrics and how to judge properly a specific campaign in order to enhance the effectiveness of marketing campaigns.
SMS Marketing Metrics
Total click
This is an easy one. Total click is a number indicating how many times links are clicked in an SMS campaign. This metric can be used to evaluate how your links and contents work.
Start your Shopify 14-day trial with FireApps
Did you know Shopify is now accounting for 20% of the e-commerce business.
Over 2200 merchants open their Shopify store everyday and 50% of them have a repeat purchase. Join them today!

Unique click
Unique clicks represent the total number of times users clicked on the link for the first time. It does not count additional clicks on the same link by the same user.

For example, if your recipient clicks for the first time in 5 links in messages, it will be counted as 5 unique clicks and 5 total clicks. In case the recipient clicks on the same link 10 times, it will be counted as 1 unique click and 10 total clicks.
Credit/Cost
The cost to send one SMS varies by country. For example, sending a message to Brazil costs you $0.107 while sending it to the UK costs you only $0.09. With Messent, you can send text messages to recipients in many different countries.
You can check the SMS credit in Messent by clicking on the “Country pricing” tab.
Order
This number is simply understood as the number of orders attributed to SMS. With Messent, you can have a detailed view of the metric order. You can track the order metric by the campaign.

Order can be used as the general sign to evaluate how effective your campaign is.
Revenue
The metric indicates revenue generated by SMS campaigns. In the Messent dashboard, you can view revenue by specific campaign and time period.
EPM (Earning per message)
Like its name, this metric shows you how much money is generated by a single message, average. It is calculated by dividing the total revenue by the total number of messages.
ROAS (Return on ads spend)
This is a marketing metric measuring how much revenue is generated for every money unit (dollar) spent on advertisement.

This is quite similar to ROI but they are not the same thing. ROI shows the bigger picture of your business whereas ROAS has a narrower view. It means ROAS focuses on the specific campaign cost rather than all costs.
You can simply calculate the ROAS by dividing Revenue by Ads cost.
Unsubscribe rate
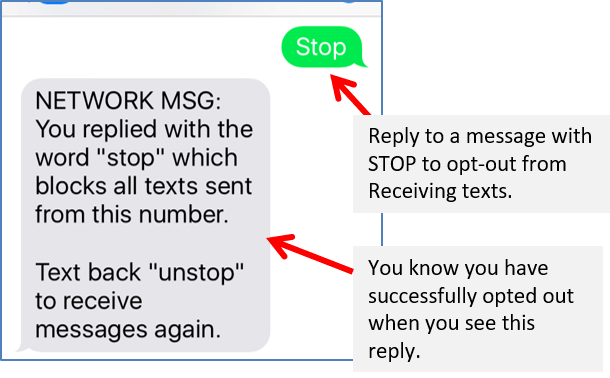
Unsubscribe rate is a measure of how many people unsubscribed from your SMS contact list. Because of SMS compliance, you are always required to tell them “how to opt-out” in recurring messages so if your campaign is not relevant or interesting enough, your customers will swiftly opt-out.

This rate is calculated by dividing the number of people who are unsubscribed by the number of total delivered messages then multiplying by 100 (Unsubscriber/total delivered messages x 100).
For example, you have 2,000 messages delivered in the last campaign and there were 52 persons opted-out. So we have:
Unsubscribe rate = 52/2000×100=2.6%
What is the best number?
We have agreed that SMS marketing is totally different from email marketing. SMS marketing has a high open-rate of over 90%. That means almost all delivered messages of yours will be read. The more people read your messages, the more the chance of unsubscribing increases because you can not make all of the audience happy reading your texts. There will be unsubscribers for sure.

The question is “what is the good unsubscribe rate for SMS marketing?” For email marketing, the standard and acceptable rate is about 0.5%. It is quite low due to the fact that email marketing has a low open rate compared to SMS marketing. Therefore, the standard unsubscribe rate of SMS marketing campaigns is between 3.5% and 5% for general. However, the standard rate is depending on the industry that you are targeting.
Do you know if you can maintain the unsubscribe rate of 5% or lower, it’s possible to increase profits by 25% to 95% (source: Harvard Business Review).

Evaluate your SMS marketing metrics
By looking at the data, we have an overview of what was happening with marketing campaigns. However, understanding is good but not enough, analyzing data requires us to take action based on our knowledge to improve every single aspect of our campaign. To do it, we need to know how to evaluate those numbers.
Unsubscribe rate
When the Unsubscribe rate has a change in the report, you know that your campaign which was launched had an impact on the contact list. It can be positive or negative, so let’s take a look at the data.
Rate increases
The rate increases when more people opted-out than before launching the campaign. That means, your campaign had issues.
The problem may come from many elements in the campaign (message content, the schedule, sending frequency, etc.) However, the unsubscribe rate is telling you to consider your campaign.
In this case, we recommend you to:
1/ Consider message content
It can be that your language is not appropriate for your target audience. Make sure to have a clear definition of the target audience, who are your potential customers, and try your best to adapt their language taste.


For example, let’s say you are selling the exotic sneakers for teenagers and youth adults, you should consider using the words and phrases that can turn them on and make them feel the “exotic” in your products. Using the formal language for such a product will make things weird in customers’ eyes and ruin your campaign.
On the other hand, make sure your call-to-action is clear and easy to understand. If you want them to do anything, go straight into it.
2/ Send less
The unsubscriber maybe someone that feels disturbed by your messages. Did you send too many messages in a short time? The recommendation is not sending over two messages a week if it is not in a conversation.


Launching a campaign with too much density of messages will disturb your customers and drain out their interest in receiving your information, which leads them to opt-out decision.
3/ Promotion
Your promotions are kinds of information and can cause some disturbance if they didn’t meet audience expectations. You can combine other metrics like order and revenue to figure out how effective your promotion is?


If the unsubscribe rate increases while order and revenue decrease, your promotion definitely does not work. Increase the discount amount, extend the promotion event, provide more benefits are some of the solutions you need to reconsider.
Rate stays stable or decreases
It is the best-case scenario for every SMS marketer. It indicates that you are going in the right way. Your content is okay, your schedule is well-planed, and promotion is nice. Everything has worked perfectly to make the unsubscribe rate stay stable or decrease. What you should do is to keep the schedule and content as they were.
However, you should always keep your eyes on the metrics because the market is not stable at all. Change can happen at any time.
Earning per message
This metric is crucial for your SMS marketing and with only it, we can have a basic result of your SMS campaign. Let’s check out how to deal with this important number.
Decrease
Of course, your campaign is not working effectively. It is a signal that you are about to waste your money in sending SMS messages. You should revise your campaign in:
1/ Segment
In this case, your segment seems to be too much wider than your potential customers subgroup. Why do we say it? Because when it comes to being too wide, it will cost you more for covering the group and decreasing your EPM.


What to do?
You have to do segmentation again to narrow your audience subgroup, simple.
2/ Number of sending messages
Once again, you have to ask yourself, did you send too many messages? If your single flow contains too many messages, it will cost you more. Simplify it to save your budget and stop disturbing your customers by reducing the messages in the campaign. Try not to send over 3 messages in a single flow.
3/ Content
When it comes to not so good results, you will be required to review your content. Your content is your voice and it is not good enough, customers would not be incentivized to take action.
As mentioned above, try to adapt your content to the customer’s style.
Increase
It is similar to the case of the Unsubscribe rate. When you have EPM going up that means your SMS campaign is working properly. There is nothing wrong to be fixed.
Evaluate ROAS
You need to know there is no certain good ROAS. It is too complicated to judge a ROAS, it depends on many factors: product quality, niche market competition, and your SMS marketing cost itself.
However, we suggest the ROAS of 3:1 is basically acceptable for general e-commerce store owners. As we have said, the ROAS of 3:1 means with every 1 dollar for ads, you earn 3 dollars revenue.
If your ROAS is lower than that?
ROAS doesn’t represent your final result. Like other metrics, ROAS just provides you a narrow view with few factors. Let’s say your campaign goal is spreading brand awareness and not focusing on “buy now” call-to-action. That kind of campaign always has a low ROAS in result though it is so wonderful that gains for you a big huge number of subscribers. There is a difference in two goals that define two kinds of campaigns. When analyzing your data, keep in mind the goal of the campaign.
Let’s find out more about the world of e-commerce here Fireapps
SMS Tutorial Series:
- What is SMS Marketing? Why you should use it over Email marketing in 2020?
- How to achieve SMS compliance?
- Contact list: The treasury of the SMS marketers
- 5 SMS segments that will make your e-commerce store perfect
- SMS marketing best practices in 2020
- SMS Automation Best Practices


Leave a Reply